I found the following information on the features spectral signitures:
Standing Water:
Highest: band 1(.45-.52), Lowest: band 6(.52-.60)
Reflectance is highest in band one because this is the blue band in the visible spectrum. After the first three bands, reflectance goes down significantly because there is very little outside of the visible spectrum.
Moving Water: Band 1 (.45-.52) has the highest reflectance
Band 6
(10.4-4.5) has the lowest reflectance
Vegetation: Band 4 (.77-.90) has the highest reflectance
Band 6 has
the lowest reflectance
Riparian Vegetation: Band 4 has the highest reflectance
Band 6 has
the lowest reflectance
Crops: Band 4 has the highest reflectance
Band 6 has
the lowest reflectance
urban grass: Band 4 has the highest reflectance
Band 6 has
the lowest reflectance
dry soil: Band 5 (1.5-1.75) has the highest reflectance
Band 4 has
the lowest reflectance
moist soil: Band 5 has the highest reflectance
Band 2 (.52-.60)
has the lowest reflectance
rock: Band 5 has the highest reflectance
Band 4 has
the lowest reflectance
asphalt: Band 5 has the highest reflectance
Band 3
(.63-.69) has the lowest reflectance
airport runway: Band 5 has the highest reflectance
Band 4 has
the lowest reflectance
Concrete: Band 5 has the highest reflectance
Band 4 has
the lowest reflectance
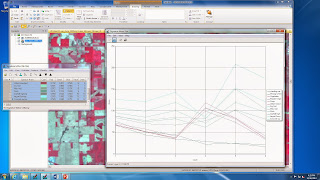
Shown below is a screen shot of all of the spectral signitures in one graph.
Vegetation
displayed high reflectance in band 4, which is the NIR band, and low
reflectance in band The reason that
reflectance was so high on the NIR band was because there is a great deal of
radiant flux energy reflected at this wavelength and there is a lot of
chlorophyll on green vegetation. In NIR,
reflectance is high for green vegetation.
Band five has the
greatest variation between dry and moist soil.
This covers the wavelength range from 1.55 to 1.75 and is the short wave
infrared band. The reason that this wavelength
has the most variation is because the shot wave infrared band picks up moisture
content very well and can be used to distinguish between moist and dry soil.
Vegetation, crops and grassland are all similar in
appearance because they peak at band 4, due to high reflectance in the NIR
band. Standing and moving water are very
similar in appearance and have fairly low values across the board and are
highest in band one. Soils are similar
but vary in band 5 due to different moisture contents picked up by short wave
infrared. Rock and asphalt are similar
in appearance, as well as the runway and concrete. There seem to be four distinct groups of
patterns and each of the four are unlike the others.
It seemed like the
most important wavelengths in this exercise were bands 1,4, and 5. Band one is valuable in identifying elements
like water, soil and vegetation. Band 4
is valuable for analysis on the reflectance of vegetation. Band 5 is important for analysis of moisture
content, especially in soils and vegetation.
I think these are the three most important bands.
NASA Landsat Program, 2000, Landsat ETM+ scene, SLC-Off, USGS, Sioux Falls, 2013.


No comments:
Post a Comment